The year 2026 marks a decisive point for entrepreneurship in Latin America, where initial promises are transformed into tangible results. After years of rapid growth...
FIF2026 positions Mexico as a strategic center for franchises and entrepreneurship in Latin America, bringing together thousands of...
In 2026, artificial intelligence (AI) is positioned as the essential basis for the creation and expansion of...
In 2026, Latin America is experiencing a profound transformation in entrepreneurship thanks to the massive integration of artificial intelligence..
CAF allocates an investment of US$ 250 thousand to promote Afro-entrepreneurship in Latin America, promoting inclusion and...
Artificial intelligence (AI) has ceased to be a secondary tool and has become the heart of entrepreneurship...
Artificial intelligence is positioned as the central engine that drives entrepreneurship in Latin America towards a new...
Latin America is positioned as an emerging hub where artificial intelligence drives the creation of new innovative ventures..
Definition and relevance of entrepreneurship in the current context Entrepreneurship is the process of creating and developing...
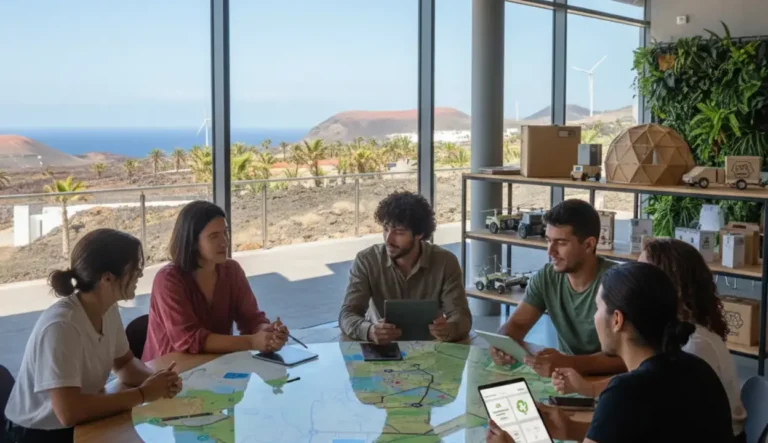
The role of the Lanzarote Chamber of Commerce and La Graciosa in the entrepreneurial ecosystem in 2025...